Starbucks in the World
Visualizing Starbucks in the world.
This small entry is to showcase all Starbucks globally, for them we will use the data provided by OpenData. The file is not very updated, so we will only use the data until 2017.
As always, we first configure our work environment:
library(leaflet)
library(dplyr)
library(tidyverse)
rm(list = ls())
setwd("/home/gelvis.rodriguez/Desktop/")
We read the data:
mundial <- read.csv("All_Starbucks_Locations_in_the_World.csv", header=TRUE)
View(mundial)
When executing the View(world) we observe that our data has the following characteristic:
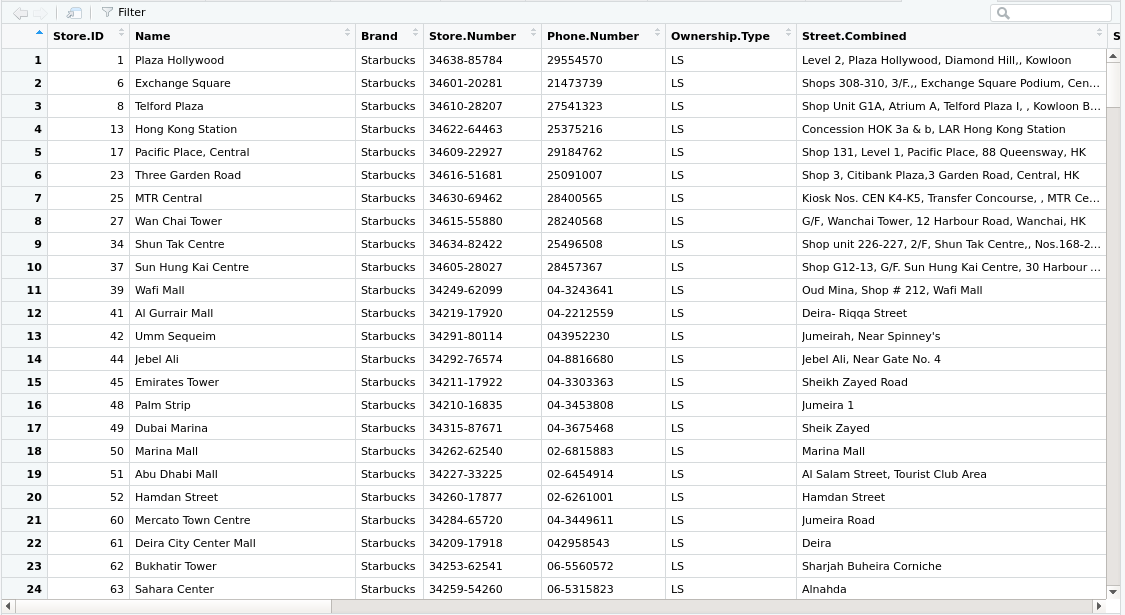
If we would like to see the corresponding names of the columns it would be enough to place them:
> colnames(mundial)
 [1] "Store.ID"                "Name"                    "Brand"                   "Store.Number"            "Phone.Number"
 [6] "Ownership.Type"          "Street.Combined"         "Street.1"                "Street.2"                "Street.3"
[11] "City"                    "Country.Subdivision"     "Country"                 "Postal.Code"             "Coordinates"
[16] "Latitude"                "Longitude"               "Timezone"                "Current.Timezone.Offset" "Olson.Timezone"
[21] "First.Seen"
>
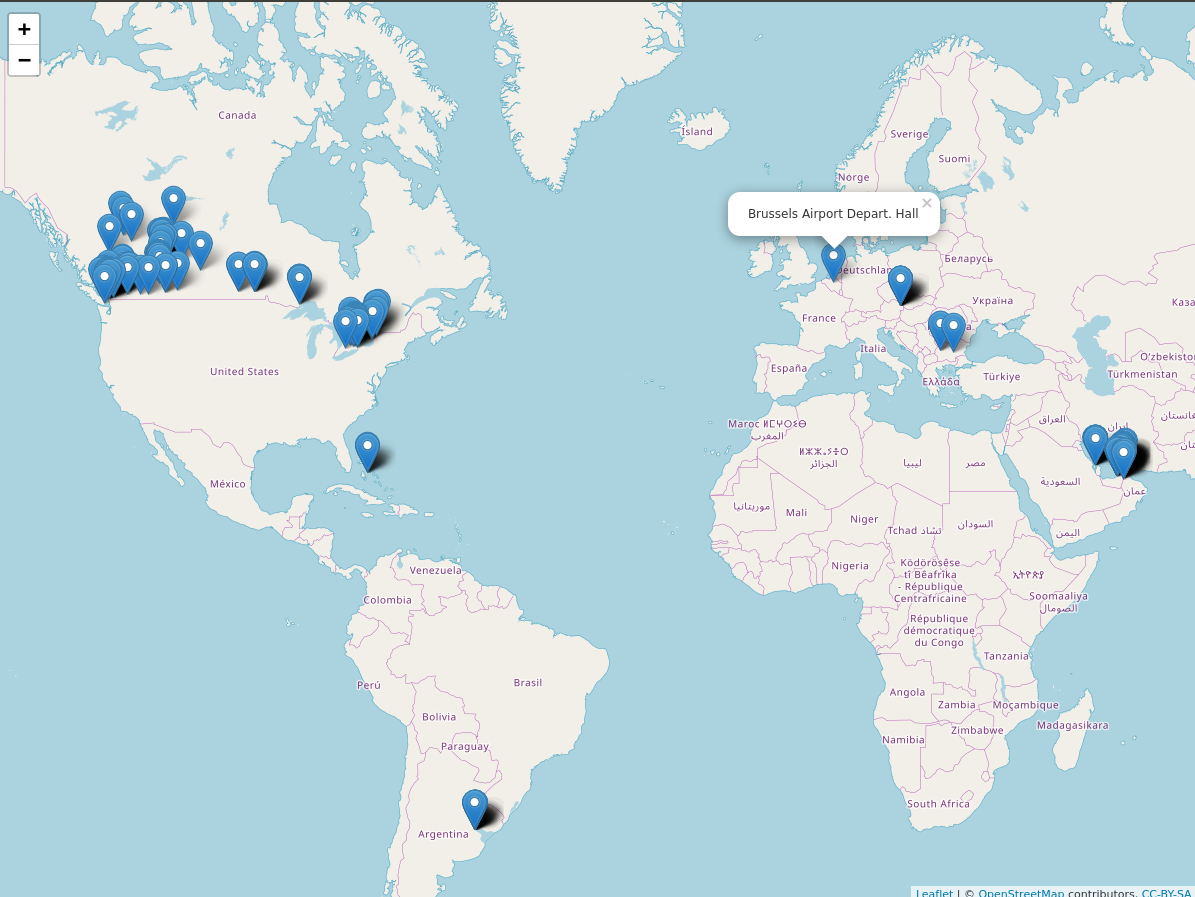
Once the data is loaded and the structure is known, we simply proceed to plot all Starbucks locations on an interactive map as follows:
total <- leaflet(data = mundial ) %>% addTiles() %>% addMarkers(mundial$Longitude, mundial$Latitude, popup = ~as.character(mundial$Name))
total
Generating:
Usually I never liked the visualization of large amounts of data, as it becomes somewhat cumbersome to understand. So for this case we will make an extraction of the data we have and we will only see the Starbucks in Argentina. For which we will do the following:
city <- mundial[, c(2,11,15,16,17)]
Argentina <- city[city$City=="Buenos Aires",]
The previous code may seem confusing, but it is simply a subset of the original DataFrame where I specify a variable called “city” that will store certain values of data stored in the variable “world”, these are the columns “2,11,15,16,17”, these columns have the information I require. Once we have the data we need, it only remains to display the information :).
Mapa <- leaflet(data = Argentina ) %>% addTiles() %>% addMarkers(Argentina$Longitude, Argentina$Latitude, popup = ~as.character(city$Name))
Mapa
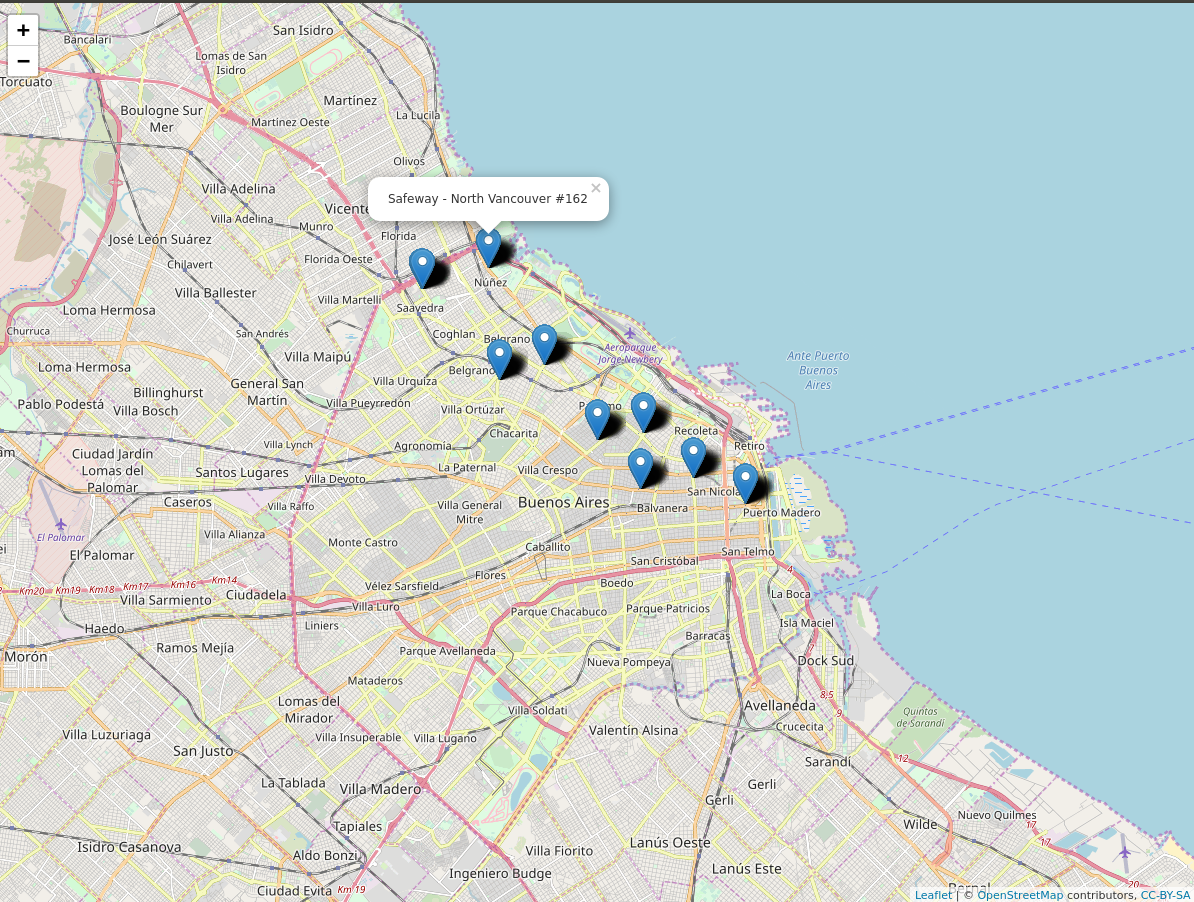
Easy, fast and presentable :).