Graphing our skills in R
Graphing our skills in R.
Recently I was reviewing the different ways of displaying information and among them I found the spider graphics. The spider graph is a type of representation that allows you to visually show what aspects, qualities and attributes are associated with a set of people, brands, services, etc., and to what extent.
For today, even though it is not the most adequate, we will simply play with this graphic over some data in our Curriculum Vitae. Since sometimes in the CV we describe in some way our skills or abilities, either by placing percentage bars or colored bars, but showing it the way I will show today is elegant and looks much more elegant.
As always, we first set up our work environment:
rm(list = ls())
setwd("/home/gelvis.rodriguez/Desktop/")
library(plotly)
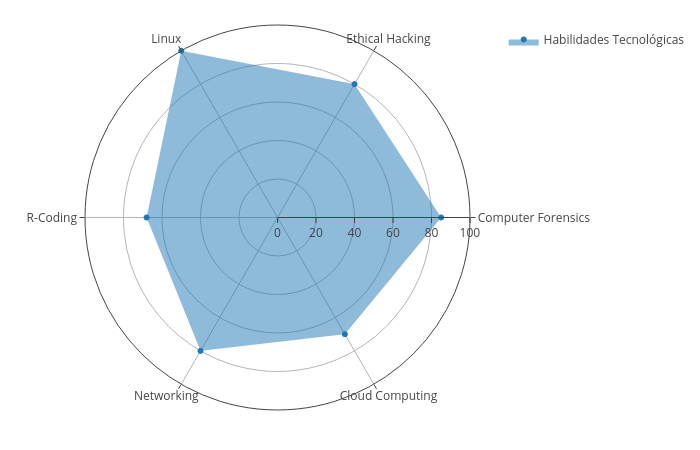
What we are going to do is simply create the graph, with two basic variables, one will have percentages and the other skills. The idea is to machete the skill with the correct percentage, for it we will do it in the following way:
p <- plot_ly(
  type = 'scatterpolar',
  r = c(85, 80, 100, 68, 80, 70),
  theta = c('Computer Forensics','Ethical Hacking','Linux', 'R-Coding', 'Networking', 'Cloud Computing'),
  fill = 'toself',
  name = "Habilidades Tecnológicas"
) %>%
  layout(
    polar = list(
      radialaxis = list(
        visible = T,
        range = c(0,100)
      )
    ),
    showlegend = T
  )
p
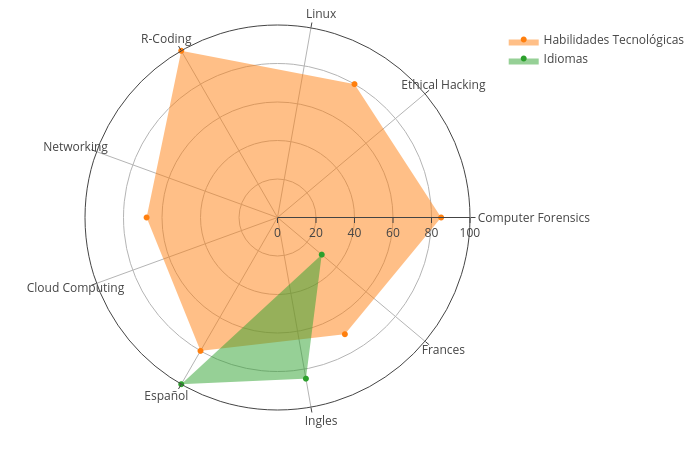
The interesting thing is that when you do them with Plotly is that it generates interactive graphics and can also be generated a little more complex with several layers or more than one, such as:
q <- plot_ly(
  type = 'scatterpolar',
  fill = 'toself'
) %>%
  add_trace(
    r = c(85, 80, 100, 68, 80, 70),
    theta = c('Computer Forensics','Ethical Hacking','Linux',
    'R-Coding',
    'Networking', 'Cloud Computing'),
    fill = 'toself',
    name = "Habilidades Tecnológicas"
  ) %>%
  add_trace(
    r = c(100, 85, 30),
    theta = c('Español','Ingles','Frances'),
    name = 'Idiomas'
  ) %>%
  layout(
    polar = list(
      radialaxis = list(
        visible = T,
        range = c(0,100)
      )
    )
  )

q
All that remains is to attach it to the CV. :)